

evitaLab after 6 months
evitaLab is still being actively developed alongside evitaDB and there are many new features that are worth mentioning. There are features for learning evitaDB as well as for debugging data.

Our usage workflow
To get the most out of evitaLab, we automatically deploy it to all our test and development environments for all applications running evitaDB. This is quite easy because we’ve taken advantage of the fact that evitaLab is already embedded in the evitaDB server running on the required environments. This way, we can easily pre-configure evitaLab to include the connection to the particular environment and deploy it to that environment.
This way, our developers can easily access evitaLab from the same URL as the application itself (just with a different port) and access their dataset with one click. evitaLab is used both by our backend and frontend developers. Backend Java developers primarily use it to debug their published data from our primary database using the entity grid. They also use the evitaQL console to debug their backend Java queries. On the other hand, frontend developers primarily use it to debug their GraphQL queries using the GraphQL console.
Of course, this is just a gist of how we currently use evitaLab, but it may give you an idea of how you can use it in your own workflow.
New features and bug fixes
Entity grid
The entity grid (previously referred to as the data grid) as a whole remains almost the same, we just add new features and polish it. As it turns out, it’s a really helpful tool for data debugging because it’s so quick to find the data you’re looking for. The biggest additions to the entity grid are:
Reference attributes
It then fetches the attributes in additional columns next to the actual references. Each cell then contains attributes for each reference in a single array. This isn’t an ideal solution, but there is not much room in such a flattened structure like a table.
However, you can use the existing detail previewer by clicking on the cell, and easily preview each attribute for each reference in full detail.
Prices
Prices are tricky to visualize because there are many of them and there is also the price for sale. Fortunately, you can now preview all of the prices in the entity grid by simply selecting them in the property selector.
However, the most important feature is hidden in the cell details. If you click on any cell with prices, you will see 3 sections in the detail window: basic entity price properties, calculated price for sale and the most important - a list of all entity prices.
The price for sale section simply visualizes the evitaDB price object.
This allows you to easily debug your prices and price list priority without rewriting your queries.
Data visualisers
Big new feature set is data visualization in evitaQL and GraphQL consoles. This is especially useful for newbies trying to make sense of large extra result JSON documents.
We’re still missing visualization for entities and query telemetry, but we feel that these aren’t the most important features right now. The reason is that entities don’t have such complex and large JSON objects like extra results, and they’re pretty straightforward. Also, because of the graph-like fetching of referenced entities, it may be difficult to visualize them properly, so we are still thinking about the right solution. As for query telemetry, it is indeed difficult to read without visualization, but it’s not the most used feature of evitaDB right now.
The visualizations are available after you execute a query in an alternative panel to the raw JSON output. You can switch between these panels in the navigation bar on the right side of the console.
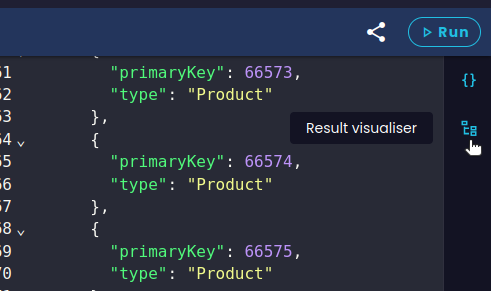 Result visualizer switch in console
There you will see a select component to select a query for visualization (in the case of GraphQL) and a select component to select a query part to visualize.
Facet summary
GraphQL field aliases and visualizer
Note that the GraphQL query supports field aliases, which effectively change the output JSON. This is something we’re unable to work with in the visualizer at the time of writing this article. For now, you can’t use aliases in the facet summary subtree, otherwise the visualizer won’t find it. We plan to support aliases as well, but it requires analyzing the input query, which is a bit more complicated and time consuming than we are willing to invest right now.
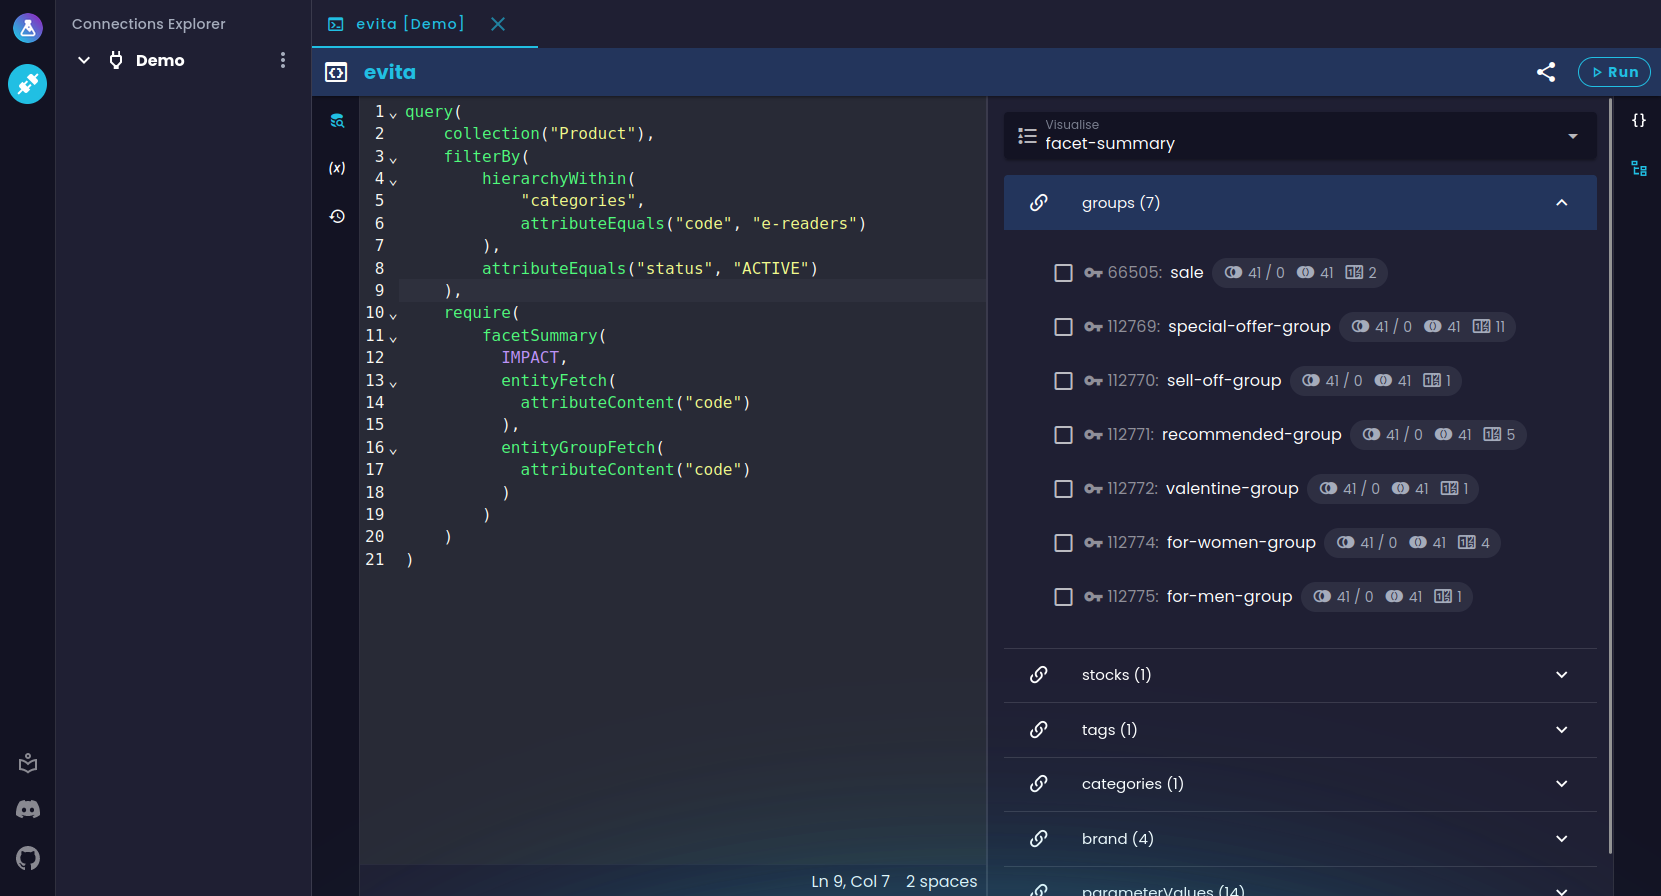 Facet summary visualization in console
Hierarchy
Hierarchy field aliases and visualizer
In the case of hierarchy visualization, there is a small exception to the field alias restriction for GraphQL. You can use field aliases to name your hierarchies and the visualizer will render it correctly with your name.
As you can see, you get a view similar to the facet summary visualization. You can browse through the individual hierarchies and directly see how your query affects the richness of each hierarchy tree.
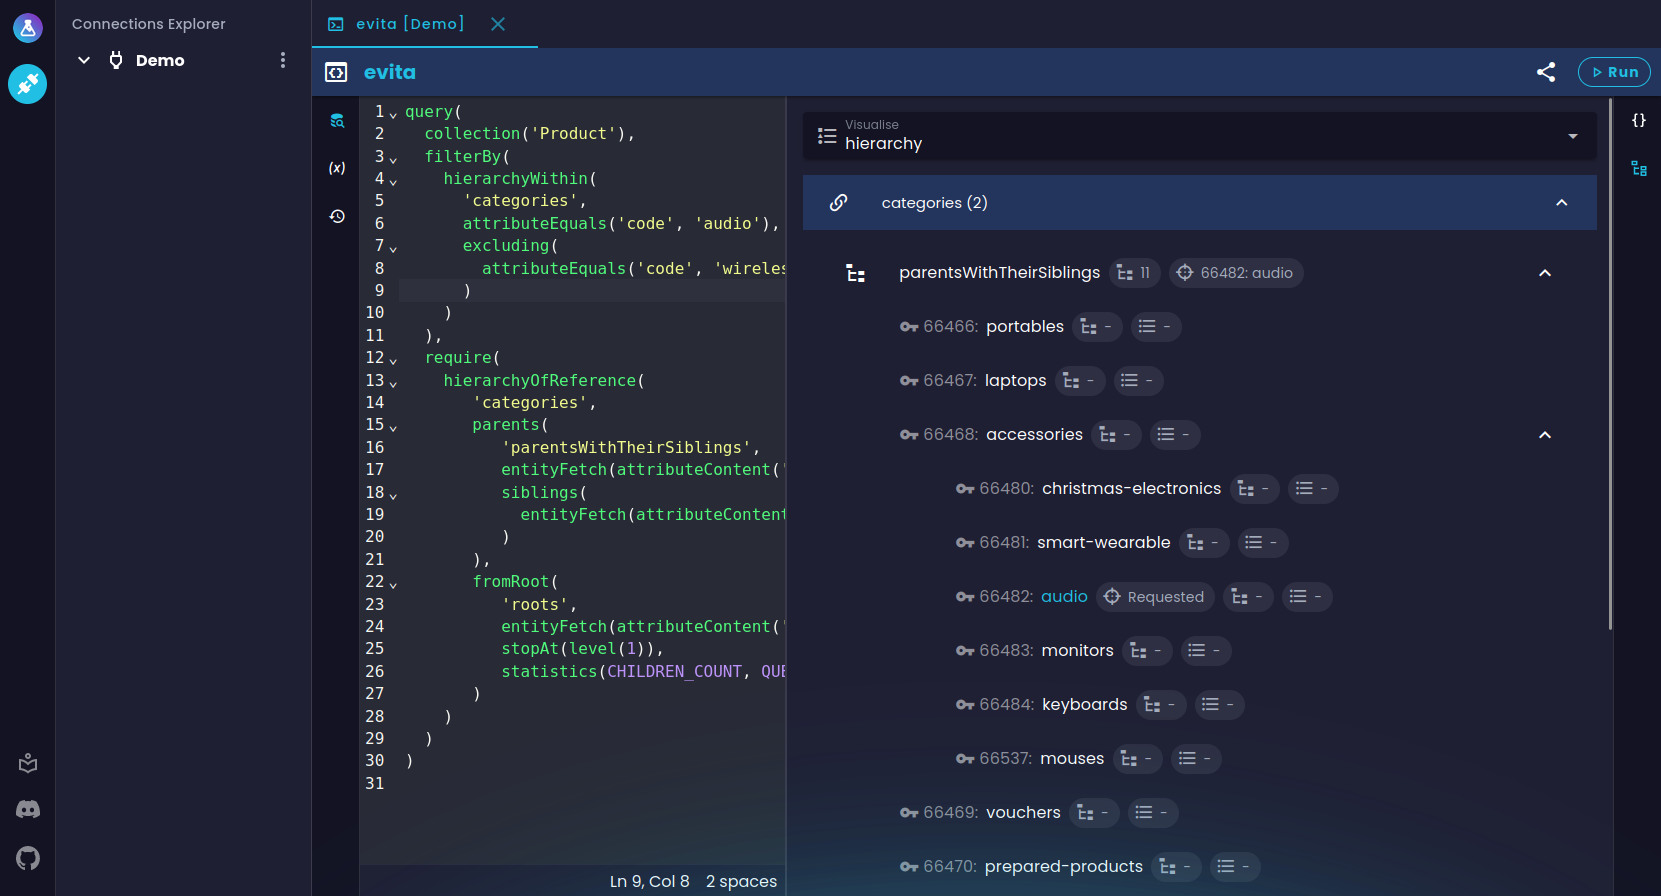 Hierarchy trees visualization in console
Histograms
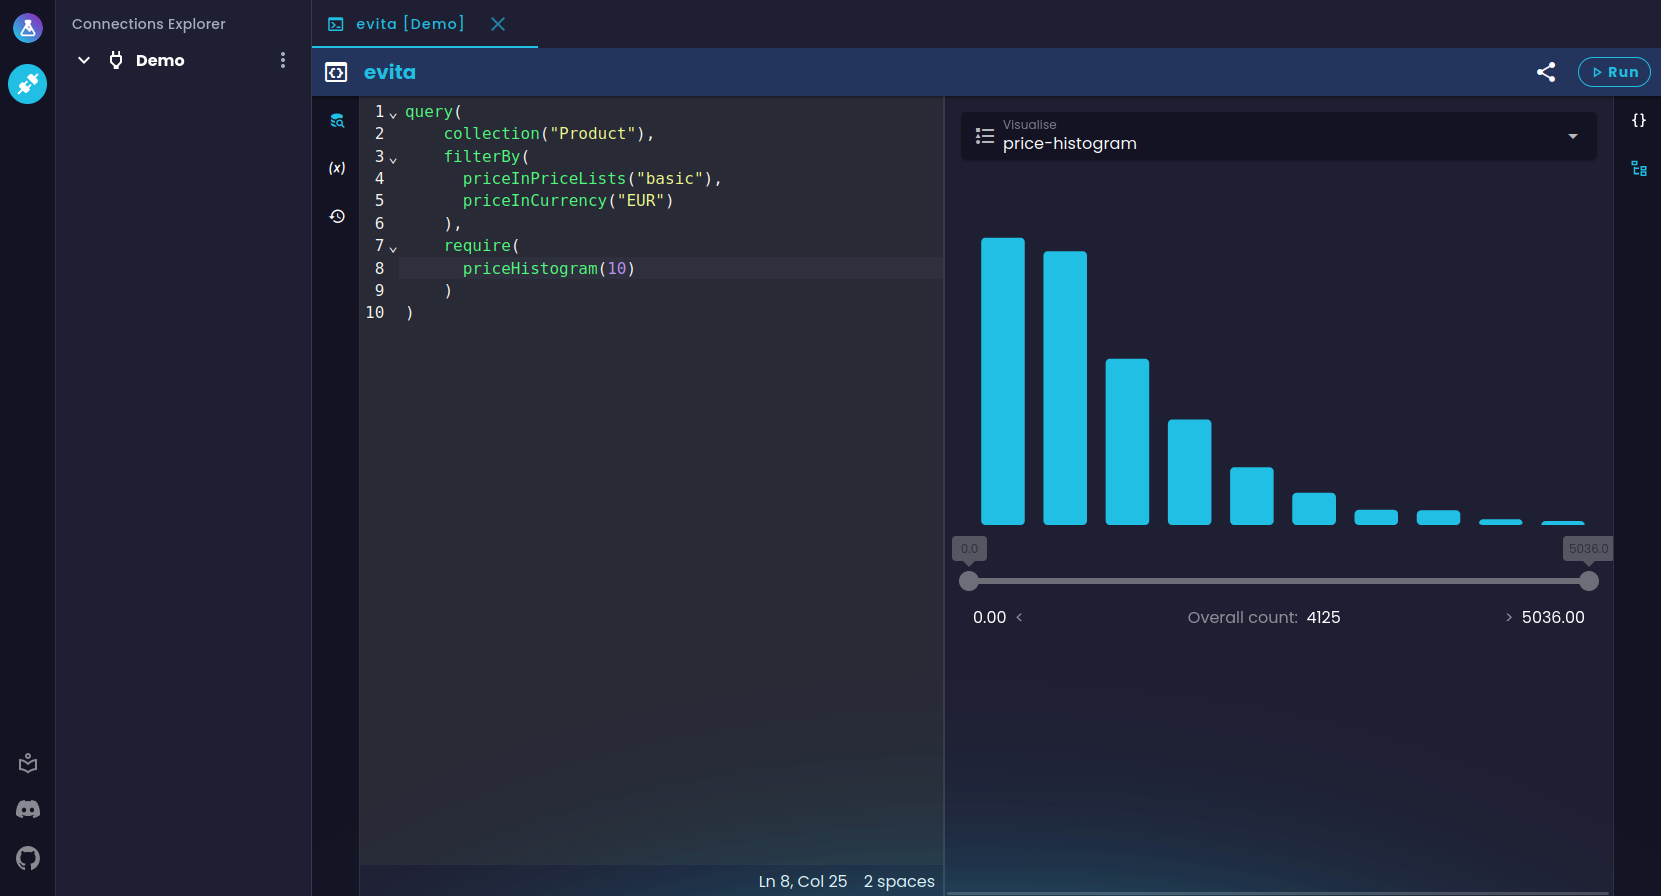 Histogram visualization in console
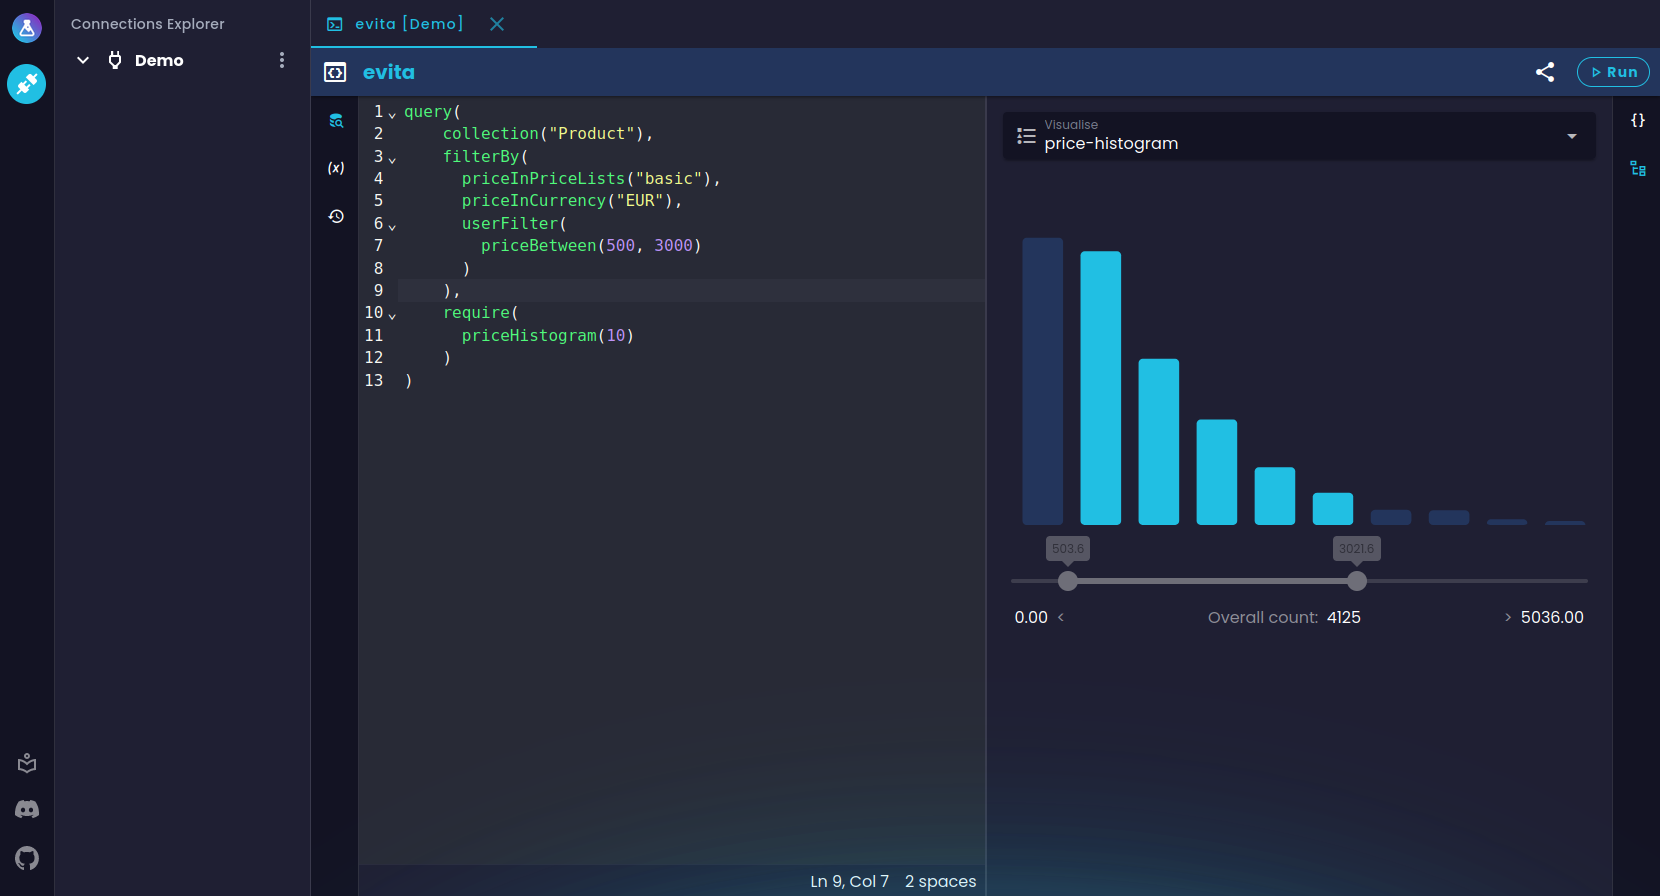 Narrowed histogram visualization in console
evitaQL language support
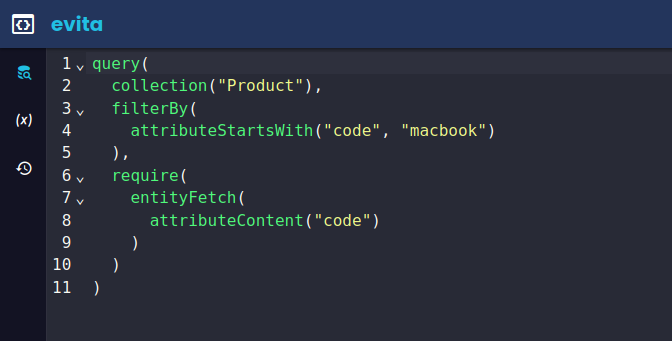 evitaQL language support in console
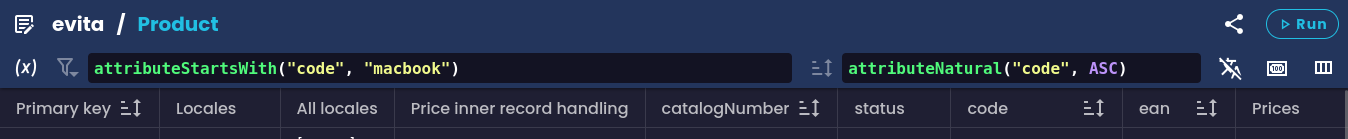 evitaQL language support in entity grid
There is also a very simple linter to check things like missing commas or the structure of the query root, and other little things like syntax highlighting, folding, or automatic indentation. Even this basic support has been invaluable when writing queries. Of course, we plan to make the support more sophisticated, but unfortunately that’s quite time-consuming.
Sharing tabs between browsers
Tab sharing between developers is something we’re very excited about. A lot of the time our frontend and backend developers share their queries via a messaging application by copying and pasting entire queries into the chat, just to debug some parts of the queries. This leads to cluttered chat conversations and communication errors when the same developers are working on multiple projects with different evitaDB server instances. That’s why we hope this feature will greatly improve communication between developers and save them some time and nerves.
You can easily share any tab with current data by sharing a link to with the other developer. An actual link targets the same evitaLab instance as yours and your data with properly set up evitaDB connection, catalog selection and so on. The receiving developer doesn't have to worry about choosing the right server, the right connection and so on anymore. All of this is embedded in the link.
As you can see, we’ve used this feature even in this article to show you custom examples that aren’t in our documentation. You can use this feature in a similar way e.g. in your own documentation, for example, by pointing to your demo instance to demonstrate your domain-specific queries.
Checkout the entire workflow in our short showcase video:
Storing last session
When it comes to restoring your workspace after some time, the absence of recently opened tabs and executed queries can be quite annoying. Especially if you have large queries that you can’t remember. With the new evitaLab you don’t have to worry about that anymore. Just close or refresh your tab or browser and evitaLab will restore all of your tabs from the last session.
However, there are two exceptions where this doesn’t happen, and for good reason.
The first exception is when you open a shared link that points to the same evitaLab. This is because the link will be always be opened in a new browser tab, even if you already have the same evitaLab instance already open, and when you open a such link (e.g. for a quick look) you don’t want your entire session to be restored as well (there may be 10 tabs in your last session). Another concern is that you might accidentally close your primary session before this new one and overwrite it with data from a shared tab. Or you could open multiple links with shared tabs, and again, you probably don’t want to restore your session for every link you open.
The session exception is when you open a query example from our documentation. The reasoning is the same as for the shared tabs link.
Query history
Similarly useful to the session transfer is the query history with the ability to browse through previously executed queries. We’ve implemented query history in all tabs that support queries, i.e. evitaQL console, GraphQL console and entity grid.
Both consoles have separate panel to switch queries with variables in one go.
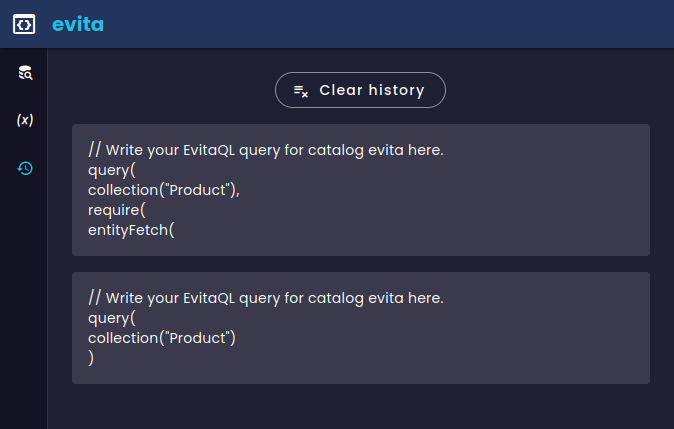 Query history in console
Each combination of connection + catalog has its own list of history records to avoid mixing different data.
Entity grid has separate histories for both filter and order parts of a query. The history for each input can then be opened via the preceding icon or with Alt+↓ (or Option+↓ for Mac).
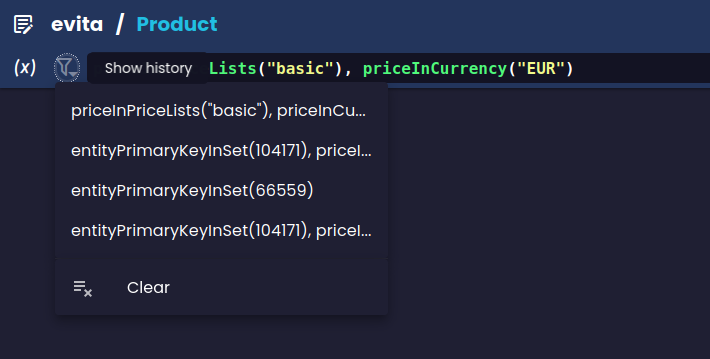 Query history in entity grid
Similar to consoles, each combination of connection + catalog + collection + filter/order has its own list of history records to avoid mixing different data.
Other small features and bug fixes
- we switched to calendar versioning from semantic versioning
- code editor have status bar with line, column, and caret information
- we fixed too long entity grid cell values occupying entire screen
- entity grid now displays selected data locale its in header
- there is a new keyboard shortcut Ctrl+F to focus the search input in the entity grid property selector
- new evitaDB attribute uniqueness types are displayed in detail in attribute flags
- filterable attribute flag has now note if the filtering is implicit for unique attributes
- there are now tooltips for connections, catalogs and collections in explorer
- and other UI improvements and fixes
There were many more small bug fixes along the way but these are the most important ones.
Planned features in near future
We still have a lot of ideas in mind, but we cannot do everything at once. Currently, we are planning to open these issues:
- status info screen for evitaDB servers
- screen with keyboard shortcuts
- quick access to explorer item actions
- time machine for new upcoming evitaDB catalog versioning features