
Our new web client, evitaLab
It's always a bit painful to troubleshoot a problem with your production data inside a database if you don't have a handy tool to look inside easily, and instead, you have to write different kinds of queries using different tools to get the information that you need. We feel the same way. That's why we've created a hopefully handy GUI client for evitaDB called evitaLab, so you have a buddy when you're either just playing with evitaDB or you're already debugging production data.

The idea behind evitaLab is simple and that is to provide a common environment for all your evitaDB instances that you need to access and manage. Currently, the main available tools are:
- a connection manager for evitaDB instances
- data visualization without the necessity to write any queries
- “query consoles” to quickly write queries (in evitaQL, GraphQL, etc.)
All the tools are accessible with a few clicks within an evitaDB instance connection.
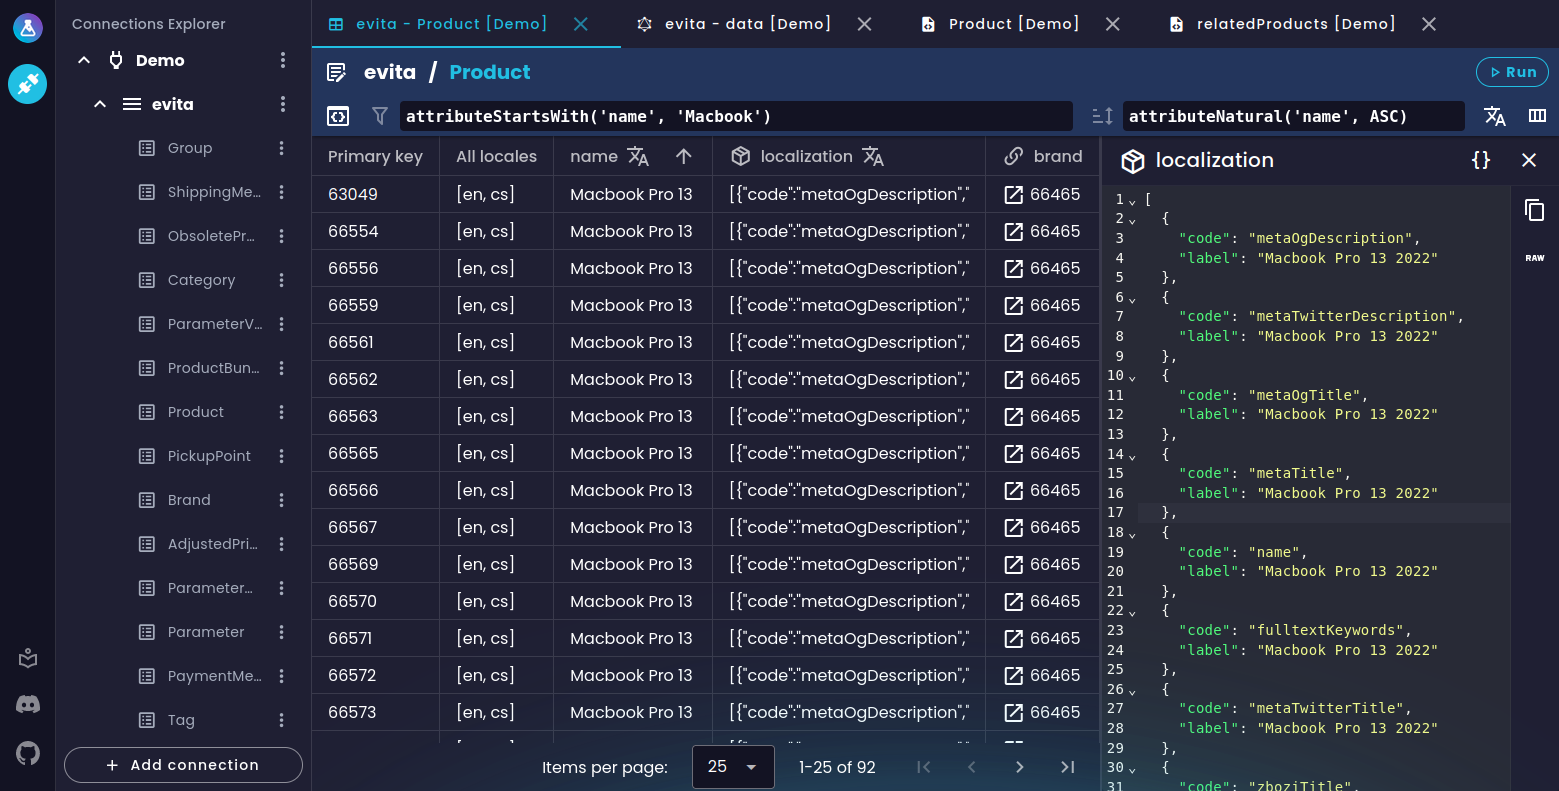 evitaLab preview
Data visualization
Data visualization is one of the main features of evitaLab. It's designed to hopefully make it easier to browse through stored data and internal data structures, because nobody wants to write tedious queries just to quickly verify some data or configuration.
Currently, we support two main data visualization tools: data grid and schema viewer.
Data grid
The data grid allows you to browse your stored entities without writing any queries. It displays flattened entities as rows in an interactive table just like in SQL IDEs. Of course, there are limits to what we can display in a flat structure, but it's a great tool for debugging or just browsing entities, because you can easily see pretty printed all the data you need in columns next to each other, or even compare multiple entities side by side.
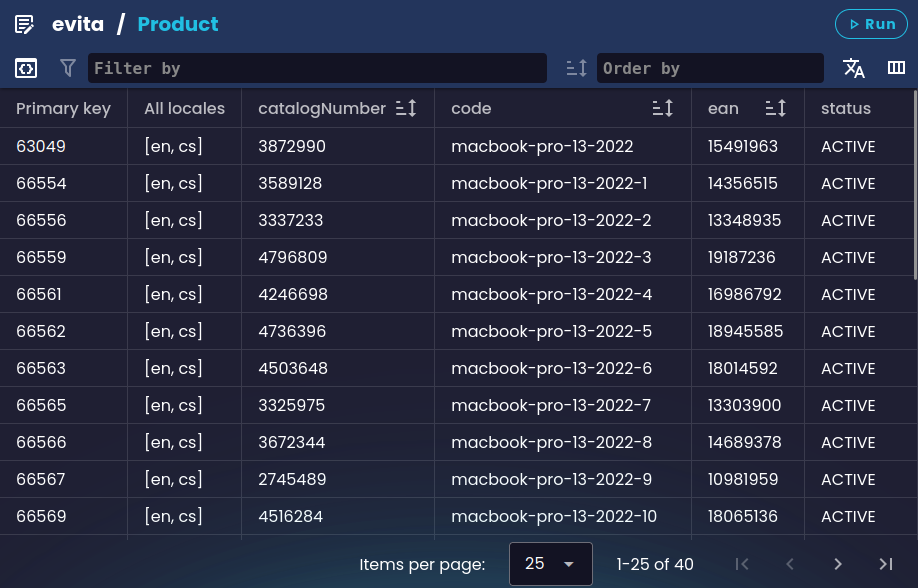 Base data grid
By default, it loads the first page of all entities in a selected collection with basic entity data and representative attributes. You can further customize it by selecting which entity data you want to see in the detailed property selector and in which locale. Because evitaDB has native support for localized data, evitaLab allows you to easily switch between different locales and see the data only in the selected locale. Note that if a locale is selected, only entities that have any data in that locale are displayed.
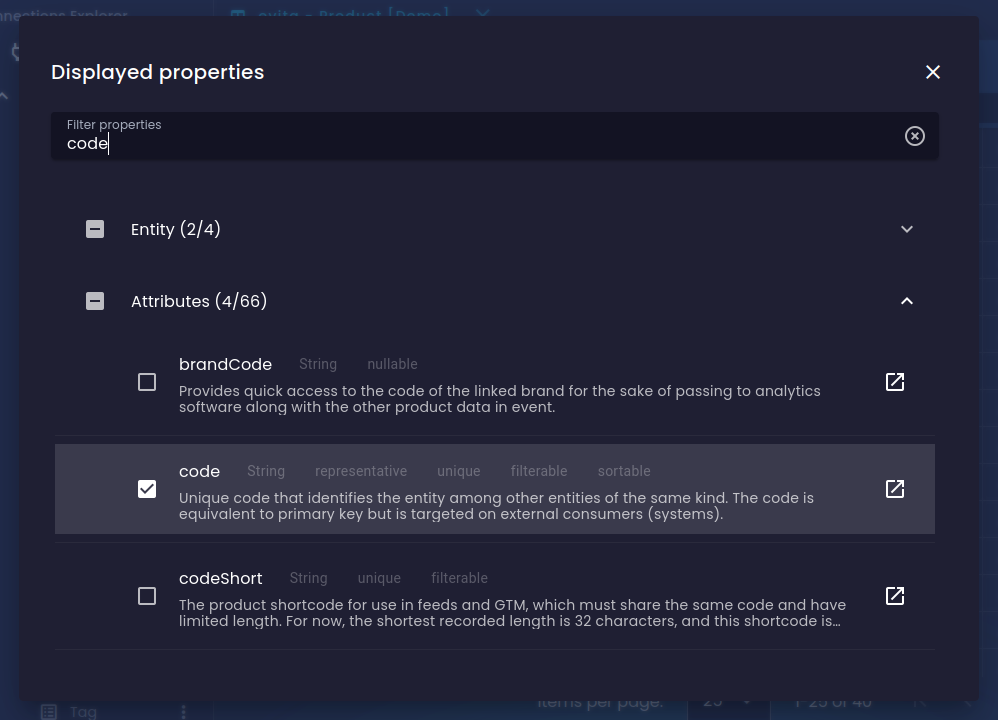 Property selector in data grid
Since just looking at all of the entities you have stored is usually not enough, you can use either evitaQL or GraphQL query languages to filter the entities. You can also order entities either by simply clicking on sortable column headers, or by manually writing an order query.
 Filtering and ordering in data grid
When you find the entities you are interested in, you can preview their data in detail. Clicking a cell with a value opens the value previewer. By default, this previewer automatically tries to pretty print the value. We currently support plain text, Markdown, JSON, XML and HTML. This means that, if the value looks like a JSON object, you will see a code editor with a pretty-printed JSON object. If the value looks like a generic XML document, you will see a code editor a pretty-printed XML document. We can also render HTML, that is present in the value, directly the detail window. Other values are pretty-printed into a Markdown document based on the data type.
 Property detail previewer
Schema viewer
The schema viewer is another tool for easy browsing without writing queries. Specifically, it allows you to browse through evitaDB schemas that represent the structure of your domain data. You can easily check descriptions, flags, attributes, references and much more. Again, with just a few clicks.
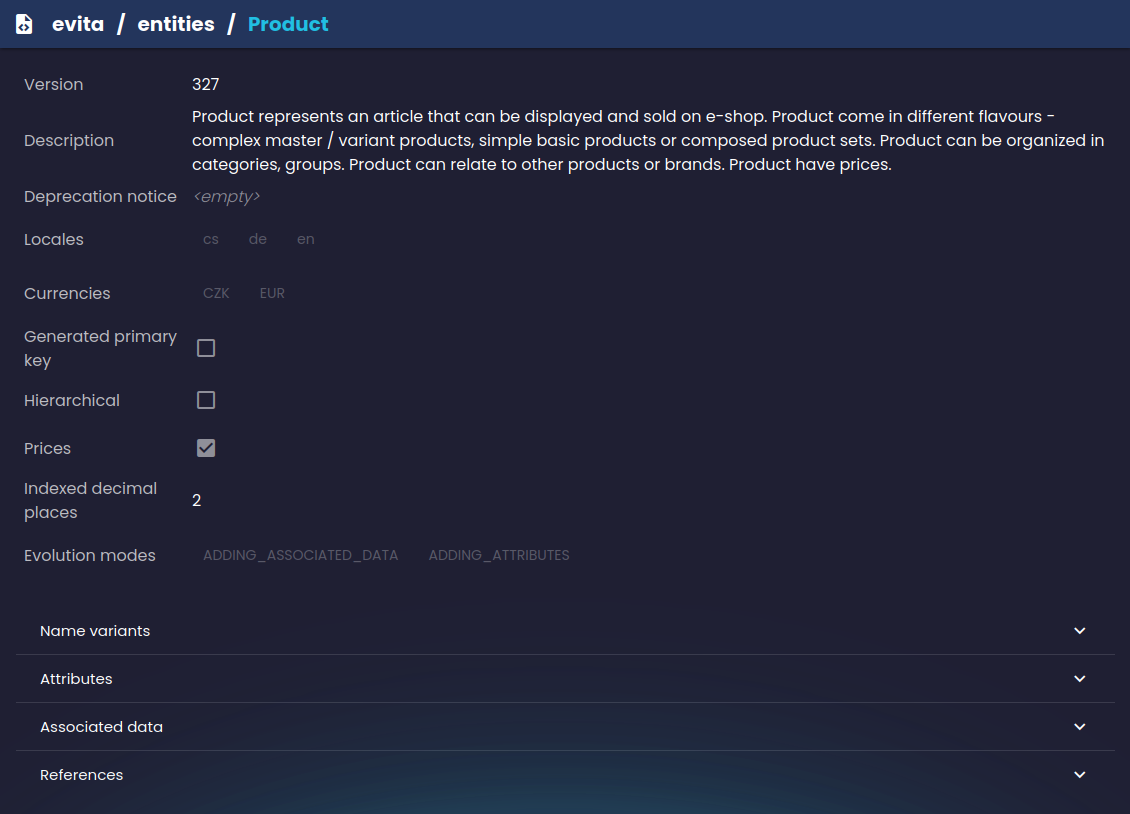 Schema viewer
Query consoles
Another large part of the evitaLab features are different types of consoles. Consoles allow you to write and execute queries in an evitaDB-supported query language.
GraphQL console
The GraphQL console allows you to write and execute GraphQL queries against a selected evitaDB instance without having to remember any URLs. It automatically fetches a GraphQL schema from the evitaDB instance and auto-completes your queries with it.
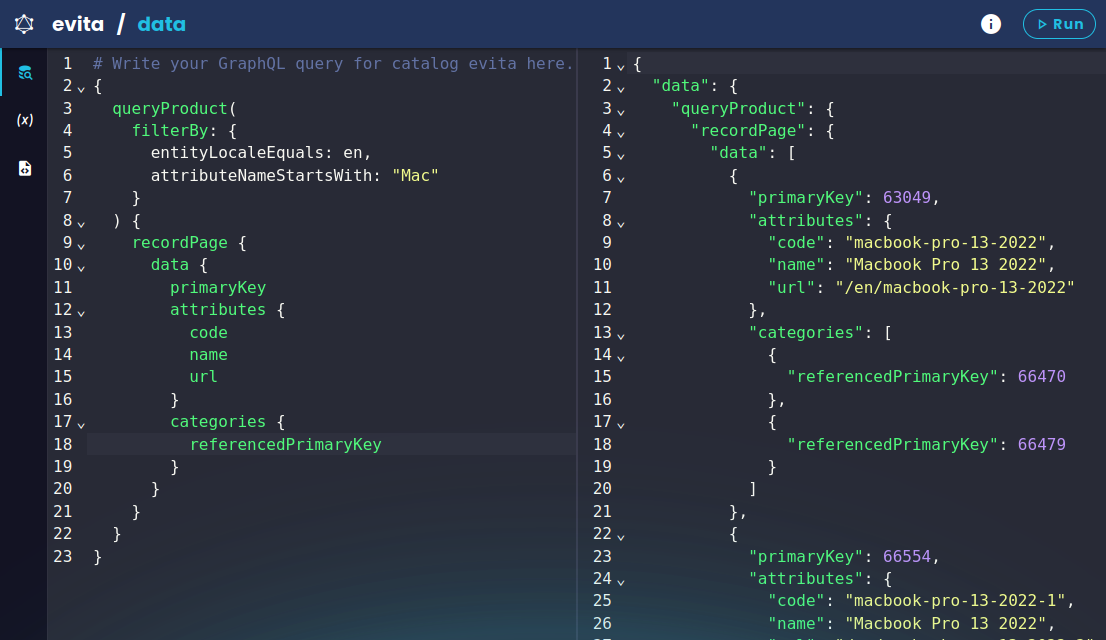 GraphQL console
Like other GraphQL editors, it supports passing variables and viewing the GraphQL schema (although the GraphQL schema is currently quite slow unfortunately).
evitaQL console
The evitaQL console is similar to the GraphQL console. It allows you to write and execute queries in our own query language. Unfortunately, unlike the GraphQL console, we don't have any autocompletion support for the evitaQL language yet.
Although we currently support parsing the evitaQL query language from string only internally in the gRPC API, you can use the evitaQL console to test Java and C# queries with a few manual transformations.
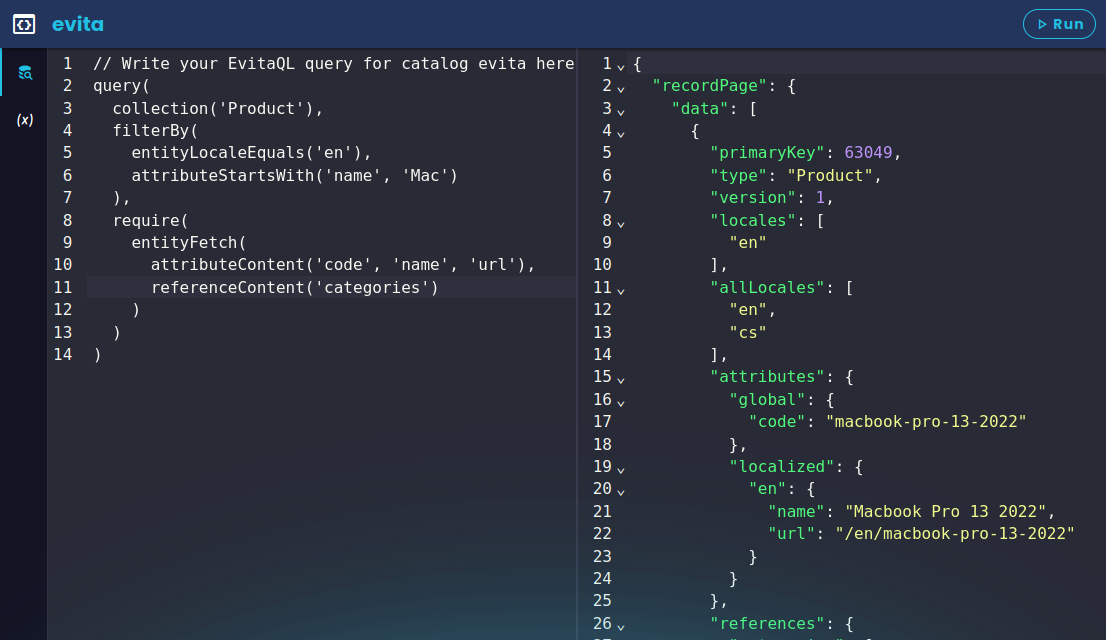 evitaQL console
In the future, we plan to support variables and autocompletion in the same way as in the GraphQL console.
REST console
Unfortunately, the initial version of evitaLab doesn't include any tools for evitaDB's REST APIs. Hopefully, we will have at least some support soon.
evitaDB connection manager
Since evitaLab is meant to be sort of an IDE for all of your evitaDB instances, it allows you to add and save connections to remote evitaDB instances so that you can easily access them with a few clicks and access all data without having to remember all sorts of URLs for different APis. You get pre-configured access to all of the features mentioned above by simply configuring a connection.
evitaDB docs interactivity
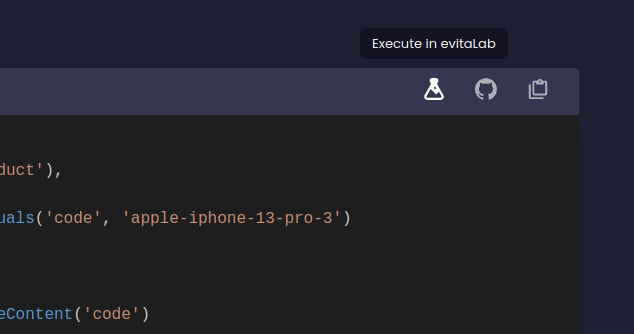 evitaDB docs evitaLab button
A specific example query is passed in the URL to evitaLab, so you can use it to share these examples with others if you want to discuss it or referenced it in an issue. But beware that only examples in the evitaDB repository are supported due to security reasons.
Running
We've designed evitaLab to be easily runnable in several different scenarios for the best developer experience. You can run evitaLab:
- by running evitaDB - each evitaDB instance contains a copy of a local evitaLab, which is exposed by default at the https://your-server:5555/lab URL
- by visiting the evitaDB demo website, where a read-only copy of evitaLab with a demo dataset is available for exploration
- as a standalone evitaLab from Docker image (temporary solution for desktop client)
The first option is the easiest way to access evitaLab with your local data if you have a running local evitaDB instance. You can even use this approach in your test environment to be able to quickly analyze evitaDB data in your remote test environment. As mentioned above, evitaDB automatically passes a connection to itself to the served evitaLab, so you don't need to configure anything.
Future plans
Technical info
Try it yourself
If you already have an evitaDB instance running somewhere, chances are you already have the built-in evitaLab instance available. Check your startup logs and look for any mentions of evitaLab. But beware, you may have an older version of evitaDB, so it is recommended to upgrade to the latest evitaDB version to get the most recent version of evitaLab as well.


